This post and the short (~1/2 hour) video above that goes with it is the first in a series that will focus on specific narrow aspects of Mitopia functionality to illustrate how to use the system to perform real analytical activities related purely to that aspect. The descriptive text of this post provides a conceptual background on the subject so that the video can focus purely on use without lengthy explanation. Detailed technical information can be found in the “Mitopia Technical Library” series of documents. The subject in this case is the “time axis” and Mitopia’s support for time-history analysis of both data content and interconnections (i.e., network visualization and link analysis).
The axis of time, together with three spatial dimensions, forms the minimum coordinate system necessary to analyze data about the real world. Like the specification of spatial ‘coordinates’ which can take many forms (spherical polar, cartesian, etc.), the specification of temporal ‘coordinates’ can be accomplished in many ways and using many ‘units’. However, unlike spatial axes, the time axis is uniquely driven not just by planetary motion, but also by religious and other connotations that have been assigned to those motions by each society. Thus to be useable the time axis is forced to align with ‘days’ and ‘years’ (solar and lunar), but the planet’s rotation means that these boundaries vary based on one’s position on the earth surface. Worse yet the natural ‘years’ do not consist of integral numbers of days, so calendrical systems must all contain intercalary periods to avoid drift. The end result is that while spatial ‘coordinates’ are generally specified unambiguously, interpreting temporal ‘coordinate’ specifications is highly ambiguous and requires a detailed knowledge of the culture and location of the source. This ambiguity makes the generalized handling of time in any system gathering data globally from multiple sources a very complex undertaking. However, since one cannot legitimately compare two ‘events’ without knowing their temporal alignment, this is a problem that any generalized system targeted at global understanding must solve pervasively. This is true of any series of ‘measurements’ taken about a complex system (e.g., IOT data), and it is particularly true when data relates to the activities of people and organizations engaged in competitive decision cycles (e.g., military conflict).
Conventionally, full time axis support requires the use of a specialized “time series” database. These databases are specifically designed for things like sensor data streams and IOT where the time history of a sensor’s value is a key analytical aspect. To provide this support these databases must be relatively uniform in content and there is little or no overt references between different data streams. In short these tend to be NoSQL databases. By contrast, relational database systems, on which most systems today are built, handle time series poorly (requiring specialized tables and access logic for any measurement for which anything but the current value is to be retrieved). Relational DBs tend to scale poorly when used for time-series data, they do however provide the ability to manipulate diverse data types and specified relationships between them.
In contrast, Mitopia’s ontology-based data model provides robust and automatic support for time history on any and all fields of all types in the ontology, including the ability to query, display, and visualize time histories of records and their connections. In most cases, analyses use the ‘current’ value, but for situations where time history (or past history) is being analyzed, that too is fully and pervasively supported. The range of analytical techniques this enables is a significant superset of that provided by any other data model.
The fact that Mitopia provides this extensive time axis support in a scaleable manner, without forcing restrictions on the data model or requiring the user to explicitly design schema (and develop GUIs/queries) to perform time-axis related analytical tasks, makes it ideal for use in a wide range of applications where time is central. With conventional approaches, historical analysis must be moved off the ‘main’ system to another more suited to the task. Once learned, Mitopia’s time-axis feature set can greatly enhance analytical productivity. No other data model or system provides such an unconstrained and pervasive temporal feature set.
In addition to Mitopia’s core role as a global end-to-end intelligence platform, example application areas where this pervasive time axis support is critical include the following:
- Analysis, use, and control of, Internet of Things (IOT) devices
- Analysis of simulation or war-gaming data.
- Analysis and control of complex and distributed equipment and industrial control systems comprising diverse sensors and actuators (e.g., electrical grid)
- Analysis of time sensitive trading activities (e.g., stock market, forecasting, sales, etc.).
- Logistics, inventories, and supply chain analysis.
- Patent analysis and legal discovery and document analysis
- Multinational corporate knowledge bases
- Social media analysis
- Census type activities
Within a Mitopia system every persistent data record derives and inherits from the root type in the ontology which is Datum. The fields of the type Datum provide full support for the time axis (see video), and thus all other data types inherit this support, for all of their fields and inter-record/inter-type connections.
All date and time values are stored in Mitopia as a ‘date-double’ where the fractional part is the time of day, and the integer part is the ‘serial day number’ or SDN (sometimes referred to as Julian days), where serial day number 1 is November 25, 4,714 BC. This system is calendar-independent and universal, and since there are many different calendar systems in use around the world (Mitopia alone supports display and conversions between 28 calendars both modern and archaic), a calendar-independent time system is essential. Converting between spatial coordinate systems is trivial, doing so in multiple calendars and time zones (including daylight savings) is much more complex and time consuming. For example, to compute Arabic astronomical calendar dates and exactly match published calendars based on it, one must compute the visibility of the new moon low on the horizon (moon diameter varies with distance, even atmospheric refraction must be taken into account) to an individual at a specific location and altitude with average eyesight, by calculating the positions of the earth, moon, and sun. This is definitely not something one would like to do during a query in the servers. A 64-bit double can represent time in Julian days to approximately millisecond precision, so Mitopia’s approach is well suited for most real-world applications. SDN’s can be negative, so any time in the past (or distant future) is also representable (not to millisecond accuracy for paleontological timescales!).
All dates and times are stored in Greenwich Mean Time (GMT), although they may be displayed in any time zone, usually the local zone for the user. This alignment of all stored times onto a consistent GMT time-line means that queries and comparisons can be executed very quickly on the date doubles across and between all sources, while leaving it entirely up the GUI to handle display and entry of times in various calendars and time zones. All GUI’s in Mitopia are auto-generated from the ontology. It is aware of all time related fields, and handles these tasks automatically (as the video shows).
The video uses readily available data sets, in English, to walk through the subject, and after briefly explaining the basics of time-axis support, goes on to demonstrate various analytical activities related to the time-axis. It shows Mitopia server processes (the terminal windows), and a single Mitopia client process (the GUI) all running on the same laptop. The video is by no means exhaustive on the subject in order to keep the run time down to 1/2 hour. Instead it focuses on showing a single example of three core aspects of time-based analysis namely:
- How to query for, display, and manipulate time-dependent data
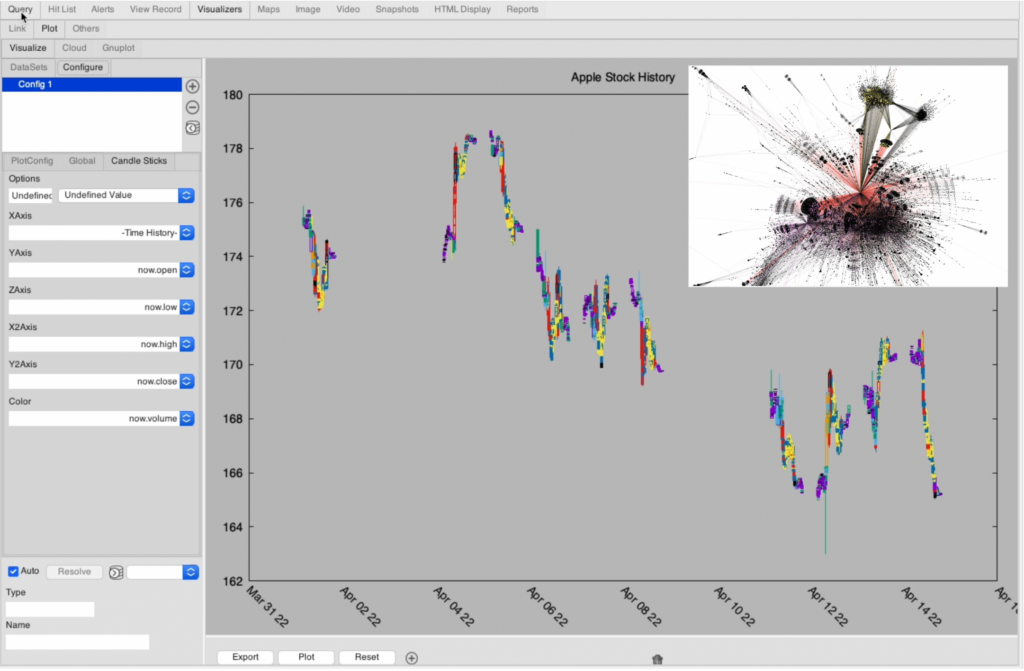
- The graphical display and analysis of time sequence data (stock history used as an example).
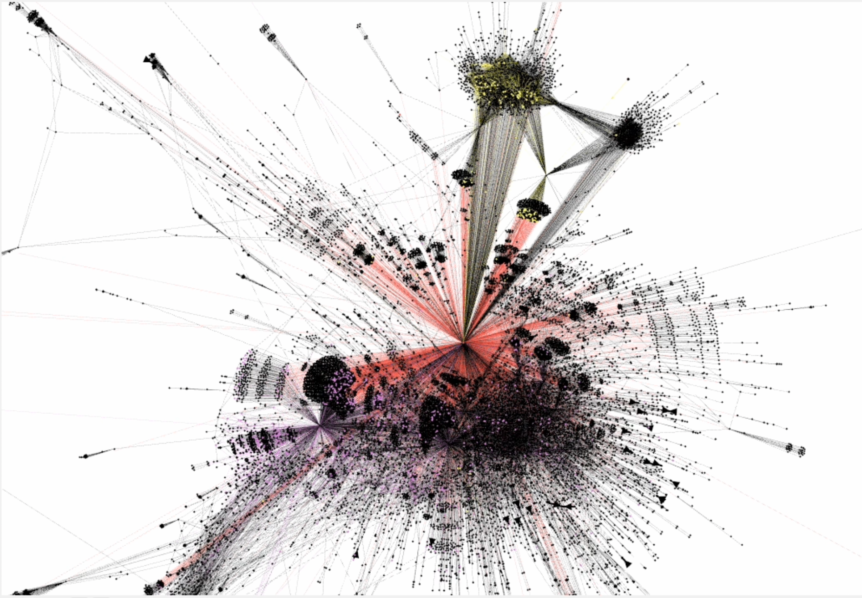
- The graphical display and analysis, including time history (referred to as ‘dynamics’ in network analysis contexts), of heterogeneous network data exported from Mitopia (emails and their enclosures used as an example).
The last two are readily understandable from the video. But the first bullet though less ‘visual’ hides numerous game changing capabilities that deserve further clarification herein:
Issuing: “Query X at time T”
Mitopia’s has the unique ability to pose a query of the form “What was the answer to Query X at Time T” for any query form “X”, no matter how complex, supported by the Mitopia server query languages (predominantly MitoPlex™ and MitoQuest™), and to do so for all types in the system and for all fields within all of those types. All this without in any way degrading the query performance of, altering the ‘schema’ for, or requiring specialized indexes for, the system data or servers. As the video shows, it does this by taking advantage of Mitopia’s patented underlying technologies allowing the user to obtain any set of interconnected data (of mixed types) desired from the servers into a single contiguous in-memory ‘collection’. Given that, Mitopia then implements a duplicate query capability syntactically and functionally identical to that provided for “now” on the servers, but performed locally and entirely differently to take advantage of that single in-memory collection.
This means specialized indexing is not required. The user simply rolls the time for the entire data set back to time T, and then issues the identical query they would have sent to the servers to ask the question for “now”, but instead using the local query stack and the collection that is applicable for time T. Like all things in Mitopia, the query stack is implemented by registered plugins, so the local query stack is simply a different set of plugins, but the data format in both cases is identical (being entirely driven by the ontology definition). The query builder GUI is the same in both cases, and completely oblivious to what query stack it is actually using. The result is that the indexing load and performance impact of maintaining and searching indexes for all past states in the servers disappears. Only the user’s machine asking the question incurs overhead, and that is minimal. The entire process of fetching, rollback, querying, and export/analysis/visualization, can be saved and scripted to allow one-click past tense or time-line analysis on any subject. These ‘past state’ collections also form the basis for time-sequence playback and analysis. The full power of the technique is not explored in the video, but the simple uses made of it should make clear the approach has a consistency and power that is unmatched by any other system. The potential for such past-state collections to be sizable is just one of the reasons why Mitopia clients, like servers, benefit substantially from running in machines with large amounts of RAM.
Data provenance and configuration control
The fact that there is a time-stamped “audit trail” of every change made to all and every field of data held in the system servers, and that each such change is annotated with the time, IP address, and user name responsible for making that change, means that Mitopia-based systems have built-in and pervasive support for tracking of all data provenance and configuration changes. On a complex system development, the time and manpower resources spent on ‘change management and tracking’ can be a significant portion of costs, so to have all the necessary data for this built into the actual system itself rather than through external tools and protocols is a major step forward. For any persistent data, the states before and after a ‘change’ can be recovered and the differences (and authors of those differences) examined entirely within the system as part of normal operations. Moreover, since these ‘audit-trails’ are maintained automatically by the substrate and not subject to user editing or erasure, the implications for Counter-Intelligence purposes should be clear.
A fundamental aspect of ‘reasoning’ over a broad domain is assigning ‘reliability’ to any conclusion based on the combined reliabilities of all the sources that contributed to that conclusion. Since all records created by Mitopia track ‘source’, this source-related reliability tracking can be done. However, if a record from a given source is subsequently altered/edited by another user or source, what then is the reliability of each edited field of that record at any time ‘T’? The built-in audit trail with its automatic tracking of the ‘author’ for each change provides a means to track changes in reliability down to the individual field level over time. If the change is caused by manual user editing, and presuming each system user is assigned a ‘reliability’, the revised field reliability would become that of the user. If on the other hand the change is caused by integration of new data from a different source through mining, then the reliability of that source determines the revised field reliability. Either way data reliability and provenance can be examined and utilized as needed at any point in time ‘T’.
Integrating data with different time spans
As the video shows, some data such as that derived from the type ‘Measurement’ is inherently focused on a time-line or time-series (Stocks in the video example), while other data is of a more ‘encyclopedic’ nature and is valid over much larger time spans. In reality any kind of broad-domain analysis will involve the simultaneous coherent analysis of many data sources whose temporal applicability overlaps, but for which the range of that validity varies by source from seconds, to decades or longer. In other words, performing such a coherent/unified analysis for any time other that ‘now’ is conventionally a very complex problem. In a conventional system that does not allow such a consistent and universal time ‘roll-back’, this simply isn’t possible, which means that these kinds of analyses cannot natively be handled, and must instead be performed largely through manual analysis across many different systems by analysts. However, because the Mitopia system allows integration of data from any and all sources, and then extraction of complete sets of all these different data types into a single ‘local’ collection for which the time can be ‘consistently’ and trivially rolled back to any time ‘T’ (i.e., any previous ‘now’), at which point that collection analyzed using all available tools, the complexity of mismatched time-spans between sources (for times other than ‘now’) fades away completely. The benefits to Mitopia-based systems that this implies are considerable.
Conclusion
The video does not cover a number of other aspects of time-series data such as isochronous playback (e.g., of videos or simulation/system states). Nor does it cover the front end processes involved in converting times discovered in system sources to the SDN+GMT format. However it should be clear from the video that a system like Mitopia that can reconstruct (or play-back) the entire system state at any previous time (while detailing when and who made such changes and from where) all without impacting normal system performance and scaleability, has many interesting applications (e.g., cyber related, counter-intelligence, etc.). We may return to look in more depth at the time-axis in future posts.
In a globally deployed Mitopia system there would be many clients (possibly running on different operating systems and with users natively speaking other languages – Mitopia is fully multilingual both user and server side), much of the data would be in other languages, and many times would be specified in other calendars and time zones within system sources. The servers would reside on multiple machine clusters elsewhere from clients, and might themselves be globally distributed. Nonetheless the exact same code, identical on each and every node, implements all such systems. All differences between the two ends of this scale are a matter of configuration using supplied configuration metaphors. Because of Mitopia’s unique approach taken to time axis support (plus many other things), such global distribution capability is built-in and requires no special action, beyond configuration, to deploy.