In earlier posts we introduced what I refer to as “The Bermuda triangle problem“, which is the inevitability of knowledge of the database content, application specifics, and GUI implementation from insidiously leaking into each supposedly isolated area and thus rendering complex software fragile and difficult to maintain. One aspect of Mitopia’s solution to this dilema is the fact that the overwhelming majority of all user interfaces are auto-generated and auto-handled based entirely on the system’s ontology which is discovered at run time. This approach removes all knowledge of the specifics of the the data from the GUI code, that is it becomes and entirely data driven user interface, and this breaks this critical dependency that commonly causes large scale project failures. We have earlier delved into the expressive power (in a GUI sense) of the tagged union concept, but have not as yet examined the broader subject of GUI auto-generation itself. In this post we will begin to explore some of the basic concepts involved in GUI auto-generation.
Since auto-generation is controlled by the ontology, we will ultimately be examining in detail the specifics of how the Carmot ontology for a system is used to generate and handle the system user interface in an automated manner. Because the user interface appearance and behavior both for display and data entry is driven directly off the ontology definition according to the principles laid out in this this (and later) post(s), it is essential for anyone using a Mitopia®-based system or contemplating changes to the system ontology, to fully understand the UI impact, as well as the persistence and query impact, of those changes (since these areas are also auto-generated/handled). Any ontology change, no matter how small, must be considered carefully from both perspectives in addition to its ontological ramifications before it is introduced.
Naming Conventions and UI Labels
In order to construct human readable control labels for a data driven user interface, it is essential that the field names within all ontological types follow a strict naming convention. When generating labels for UI, Mitopia® processes the raw field name (not the entire path) as follows:
- Convert underscores to spaces, capitalizing any letter that immediately follows the underscore
- Capitalize the first letter
- Insert a space in front of every capitalized letter that immediately follows a lower case letter
- Capitalize any letter that immediately follows a ‘.’ character (field path delimiter)
- De-capitalize the first letter of any of the following filler words (unless they start the sentence): “an”,”and”,”of”,”the”,”or”,”to”,”is”,”as”,”a”
So for example:
“aFieldName” would become “A Field Name” in the UI, as would “a_field_name“
“timeOfDay” would become “Time of Day” in the UI, as would “time_of_day“
By careful choice of the name given to a field it is therefore possible to ensure that the label for that field as shown in the GUI is easily readable by human beings. The use of case to indicate implied word boundaries in this manner is often referred to as CamelCase. One thing to watch out for is making the field name too long as this may cause it not to fit well into the allocated display area. By convention, field names within all Mitopia® and Carmot types should start with a lower case letter (preferably not k – which implies a constant). Because the first letter of the field name is capitalized in the process above before it is displayed, the use of a leading lower case letter allows field names to be distinguished immediately from type names within the code by virtue of the fact that type names by convention always start with an upper case letter. Additionally, although the algorithm above handles underscore characters by converting them to a space, by convention the underscore character should not be used in field names, since spaces can always be created by a transition from lower to upper case. An additional convention used in field naming is that any field that starts with a leading underscore character should be ‘invisible’ in the UI. Invisible fields are often introduced into Carmot types in order to ‘pad’ the field alignments to ensure that the structure layout is invariant across all architectures and compilers.
All field and type names in the Carmot ontology must be readable and understandable in English and contain only ASCII characters, it is not acceptable to name fields based on other languages. This is because the GUI labels created from field names by the algorithm described must be translated into other languages when the GUI language is switched from English. The Mitopia® translation capability that is responsible for this is predicated on the fact that all initial text strings are in English and so this must also be true of Carmot field and type names.
When choosing a field (or type) name, you should be careful not to let the specific situation that caused you to add the field influence the field name any more than is appropriate. If you have designed your ontology change correctly, then you will have abstracted from your specific problem and will probably be adding a field to ancestral or referenced types. Nothing is more confusing than a field name in some type that does not make sense when viewed entirely from the perspective of that type. Even if this means that the field name you use to enter your information is not the one you might have chosen if the domain were restricted just to the original problem that prompted the change, it is essential that you follow this approach, otherwise it is unlikely that anyone will use the new field in any other descendent types. Over time this leads to a fragmented ontology where multiple fields serve similar purposes at different levels of the ontological hierarchy. This in turn makes data stored in this manner less useful for analytical purposes and even for search.
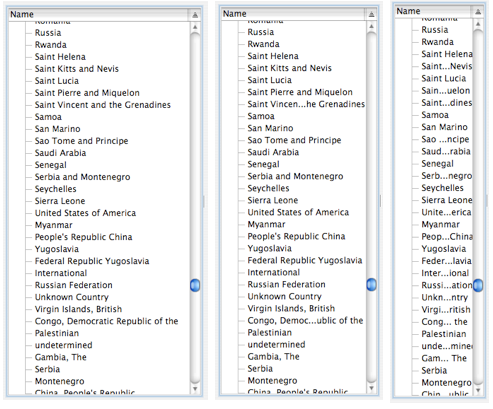
If a field name will not fit into the available display area in a given layout, the GUI renderer is responsible either for re-layout of the GUI to ensure full label readability (preferred), or failing that for eliminating a portion of the name display and replacing it with the ellipses character(s) (i.e., ‘…’) while maintaining as much of the original label name as possible in order to allow the full label to be easily guessed by the user. The screen shots to the left illustrate this effect in the case of successively re-sizing a list control displaying country names. This effect is more likely to occur with actual control labels following translation of the display to another language, since the translated string might occupy much more space than the original.
Browsing Collection Nodes
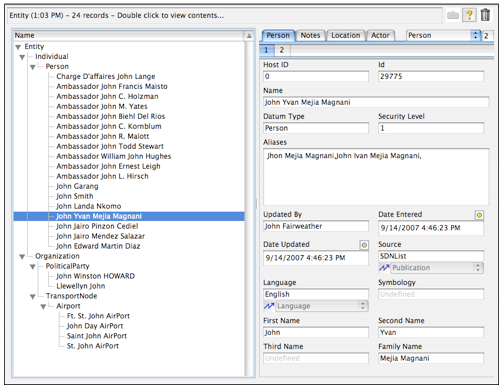
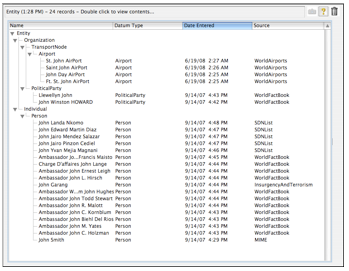
The screen shot to the right illustrates the two main aspects of displaying and browsing Carmot data organized in a collection. On the left side is a list control which is being used to browse a hierarchical collection of nodes organized according to the Carmot ontology for the system. On the right side is the display of the fields/contents of the selected node in the collection. The display of node values is accomplished by the “Data-Model View Control” (DMVC), which will be described later.
As can be seen, the hierarchy of nodes in the collection can be navigated in the list control using disclosure triangles. The non-leaf nodes are named by Mitopia® according to the Carmot ontology type and so this is displayed in the GUI. In the case of leaf (i.e., valued) nodes, the actual collection node is not named but the DataModels abstraction is aware of the requirement that all persistent data have an ‘@name’ field and so when asked by the GUI renderer for a node name, it returns the content of this field. The result is a list display where every node has a recognizable name.
You will note that the list control shown is only showing collection type nodes from ‘Entity’ downwards despite the fact that like all collections derived from persistent data, the collection being displayed has a root node called ‘Datum’. This reduction of clutter is accomplished by only starting to display collection nodes from a parent node that has more than one child. Since the list shown is the result of a query for ‘Entity’ whose name contains the word “John”, there are no other children of higher ancestral types like ‘Datum’ or ‘Actor’ and so the list can omit these nodes when displayed. The obvious result of this is that if the collection contains only one distinct type then it may be displayed as a straight linear list without any disclosure hierarchy.
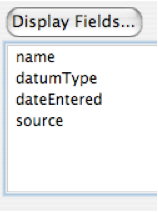
The list may contain multiple columns, each of which displays the content of a particular field. The initial column list is driven by the $ListSpec annotation however the user can control this column set, for example in the Query Builder the user might have chosen additional fields using the “Display Fields…” button in the Query Builder which would yield the collection browser list shown below:

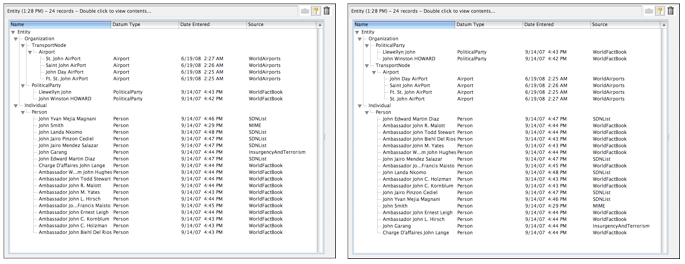
The node name is always the first column displayed and cannot be eliminated since it is necessary to display the hierarchy. Obviously the purpose of displaying additional columns is to allow the user to more rapidly determine the information they need to know simply by examining the list. Note that there are three different types of fields involved in the columns selected in the screen shot. The ‘datumType’ field is a character string, the ‘dateEntered’ field is a double precision floating point number, and the ‘source’ field is a persistent reference (‘#’). The GUI renderer makes use of Mitopia® API functions to convert any field value, regardless of type, to a string that can be displayed and thus the renderer does not need to implement this logic internally.
Another key capability of the multi-column list is that the user can use such a list to sort displayed data according to whatever criteria he wishes. Sorting is initiated by clicking on the column header to sort by, while (in the renderer depicted) sort direction is controlled by the direction triangle in the top right of the list control. All sorting is performed by the renderer calling back into one of Mitopia’s DataModels API functions and then simply re-rendering the collection which is sorted within the Mitopia® flat memory model and thus returns nodes in a different order to that used previously. Note that in the final sort the user held down the ‘Option’ key while sorting on a text field and this has the effect of sorting as if the field text string were written backwards, i.e., last letter to first.
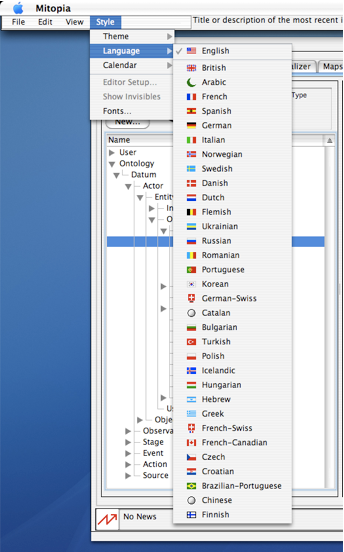
Clearly, a list control is just one of the possible means of navigating a hierarchy and the renderer may choose to use different methods depending on the situation and layout constraints. Regardless of the method chosen, the renderer callbacks into the DataModels API are identical. The screen shot to the right shows the user navigating the main “View” menu of the Mitopia® application. This is also a collection hierarchy but in this case the renderer is using a menu-bar rendering strategy to display the data it discovers. In this case the nodes found within this collection under “Language” have icons associated with them (which are discovered by the renderer using the DataModels abstraction which keys off the $Icon annotation).
Obviously popup menus are yet another variant that can be used by renderers to display and navigate a collection hierarchy.
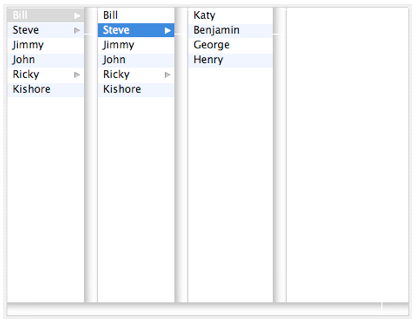
The ‘Column View’ approach to representing and navigating a hierarchy is a useful alternative to the list control in cases where the number of children below a given node in the tree can be so large, or the tree becomes so deep, that it becomes difficult to maintain visual context of where one is in the hierarchy.
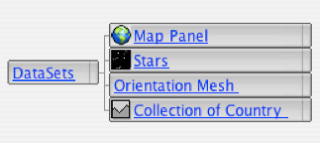
Another useful UI metaphor for hierarchy navigation is the ‘Graph View’ which provides a scroll, pan, and zoom workspace within which the node hierarchy can be navigated and explored. You can see an example of this navigation metaphor in the Visualizer widget when navigating the collection of ‘things’ within the control room as shown below.
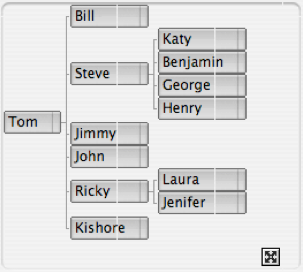
Another example (which matches the column view content above) is shown below:
Below the surface, all of the navigation metaphors shown in this post use the identical set of DataModels data discovery API calls to determine the content of any collection of persistent data. All are effectively equivalent and interchangeable, depending on UI layout considerations. This is very analogous to the MVC design pattern which allows the specifics of the UI to be kept separate from ‘Model’, however in this case the entire process is performed dynamically from the Carmot ontology, and so the separation is complete. There is no specialized ‘Model’ code to support the renderer’s GUI strategies.
In
future posts we will examine additional data driven user interface strategies to display the content/fields of data as opposed to the hierarchy of the node organization within the
collection.